
What are greenhouse gases and greenhouse effect?
Greenhouse gases. It is difficult not to have heard about them, especially concerning global warming and climate change. However, few people know what they are, where they come from, or how these gases behave.
In this article we will address these and other questions that will help you better understand the complexity of climate change.
Gases and the atmosphere
All matter is made up of atoms that are linked together by bonds. The strength of these bonds correlates to the matter’s mobility, which also affects its state.
When the matter is in a gaseous state, its atoms are weakly bonded, and therefore the matter is very mobile. This is why gases occupy all available space, creating our atmosphere.
Due to gravity, most gases are concentrated in the troposphere, which is the layer of the atmosphere that extends from the ground to a height of between 7 and 15 km.
The gases that compose the atmosphere and the amount each gas occupies in it have been changing throughout the billions of years of our planet’s existence. Currently, the Earth’s atmosphere is composed mainly of Nitrogen (78,084%), Oxygen (20,946%), and Argon (0,934%).

The small remaining percentage contains, among others, the greenhouse gases.
What is the greenhouse effect?
When the Sun’s beams reach the Earth, some of the radiation they possess is absorbed by the Earth’s surface, heating it. When it is hot, the Earth’s surface begins to emit thermal radiation into the atmosphere, mainly in the form of infrared light. Most of the radiation manages to reach outer space because the majority of gases in the atmosphere (nitrogen and oxygen) are not affected by it.
Greenhouse gases, however, absorb infrared light, causing them to increase in temperature and emit thermal radiation in all directions, including back to the Earth’s surface.
This phenomenon allows the Earth’s surface to retain some of the heat it receives from the Sun and is called the greenhouse effect. Thanks to this effect, the Earth’s surface maintains an average temperature of 15ºC, while in the absence of this effect the average temperature would be about -18ºC.
It is therefore important to understand that the greenhouse effect is not something caused by humans, but rather is a natural phenomenon that maintains life on Earth as we know it.
However, human activity has increased the natural proportions of greenhouse gases in the atmosphere, which increases its capacity to retain thermal radiation.

Greenhouse gases of human origin
For most of our history, human activities had no impact on the atmosphere, until the 18th century when the steam engine was invented. This led to the Industrial Revolution and the massive burning of coal as fuel. That is why when global warming is analyzed it is done by comparing current levels of gases and temperature with pre-industrial levels, although the exact year in which to locate that “pre-industrial” point is still a matter of debate [1].
For many years, the existence of the greenhouse effect and the human influence on it was unknown. As knowledge of climate increased and the advancement of technologies capable of measuring it advanced, the first concerns regarding the climate arose among the scientific community. This led to the creation of the Intergovernmental Panel on Climate Change (IPCC) in 1988.
This scientific institution, established by the World Meteorological Organization and the United Nations Environment Programme, aims to provide reliable information on the current state of climate change to policymakers and other stakeholders.
Next, using the information provided by the IPCC, we will see which are the main greenhouse gases of human origin, where they come from and what role each one plays in global warming.
Main greenhouse gases
| Gas | Pre-industrial levels | Current levels (2011) | Lifetime in the atmosphere (years) | Global Warming Potential (100 years) |
|---|---|---|---|---|
| Carbon dioxide (CO2) | 278ppm* | 391 ppm | ** | 1 |
| Methane (CH4) | 722ppb | 1803 ppb | 12 | 28 |
| Nitrous oxide (N2O) | 270ppb | 324 ppb | 121 | 265 |
| CFC-11 | 0 | 238 ppt | 45 | 4.660 |
| CFC-12 | 0 | 528 ppt | 100 | 10.200 |
| CFC-13 | 0 | 2,7 ppt | 640 | 13.900 |
| CFC-113 | 0 | 74,3 ppt | 85 | 5.820 |
| CFC-115 | 0 | 8,37 ppt | 1020 | 7.670 |
| HCFC-22 | 0 | 213 ppt | 12 | 1.760 |
| HCFC-141b | 0 | 21,4 ppt | 9 | 782 |
| HCFC-142b | 0 | 21,2 ppt | 17 | 1.980 |
| HFC-23 | 0 | 24 ppt | 222 | 12.400 |
| HFC-32 | 0 | 4,92 ppt | 5 | 677 |
| HFC-125 | 0 | 9,58 ppt | 28 | 3.170 |
| HFC-134a | 0 | 62,7 ppt | 13 | 1.300 |
| HFC-143a | 0 | 12 ppt | 47 | 4.800 |
| HFC-152a | 0 | 6,4 ppt | 1 | 138 |
| SF6 | 0 | 7,28 ppt | 3.200 | 23.500 |
| SO2F2 | 0 | 1,71 ppt | 36 | 4.090 |
| NF3 | 0 | 0,9 ppt | 500 | 16.100 |
| CF4 | 35ppt | 79 ppt | 50.000 | 6.630 |
| C2F6 | 0 | 4,16 ppt | 10.000 | 11.100 |
| CH3CCl3 | 0 | 6,32 ppt | 5 | 160 |
| CCl4 | 0 | 85,8 ppt | 26 | 1.730 |
| References | [2] Table 8.2 | [2] Table 8.2 | [2] Table 8.A.1 | [2] Table 8.A.1 |
* Concentrations are measured in parts per million (ppm), parts per billion (ppb), or parts per trillion (ppt); 1 ppm for gas means there is one molecule of that gas in every million molecules of air.
** The persistence of CO2 in the atmosphere cannot be quantified with a single figure, as it varies from hundreds to thousands of years. This is because the natural processes that absorb CO2 are very diverse and require different periods of time. [3]
Explanation of each column:
- Pre-industrial levels: The concentration of gases in pre-industrial times, taking the year 1750 as a reference. These levels have been determined by analyzing the air trapped in the ice layers in the poles [4] Chapter 2.2.
- Current levels: The 2011 levels are shown, as they are those used by the IPCC in its Fifth Assessment Report. Pending the publication of the Sixth Report in 2022, it is worth mentioning that the World Meteorological Organization reported in its last bulletin that CO2 levels had reached 407ppm by 2018.
- Lifetime in the atmosphere: It is the time that the gas remains in the atmosphere until it is eliminated by various natural processes.
- Global Warming Potential: The Global Warming Potential (GWP) of a gas is a measure of the total energy that a gas absorbs over a given period of time compared to carbon dioxide, which has a GWP of 1. For example, methane absorbs 25 times more energy in 100 years than an equivalent mass of carbon dioxide.
Source of emissions
Carbon dioxide (CO2)
There are two ways in which human action increases levels of this gas: direct emissions and the destruction of natural CO2 sinks.
These sinks are the oceans, the plants, and the soil. Deforestation and land-use changes for agriculture and livestock reduce the total capacity of the planet to absorb CO2 naturally.
Direct CO2 emissions come mostly from the burning of fossil fuels and industrial production. Cement production accounts for most of the industrial emissions [5].
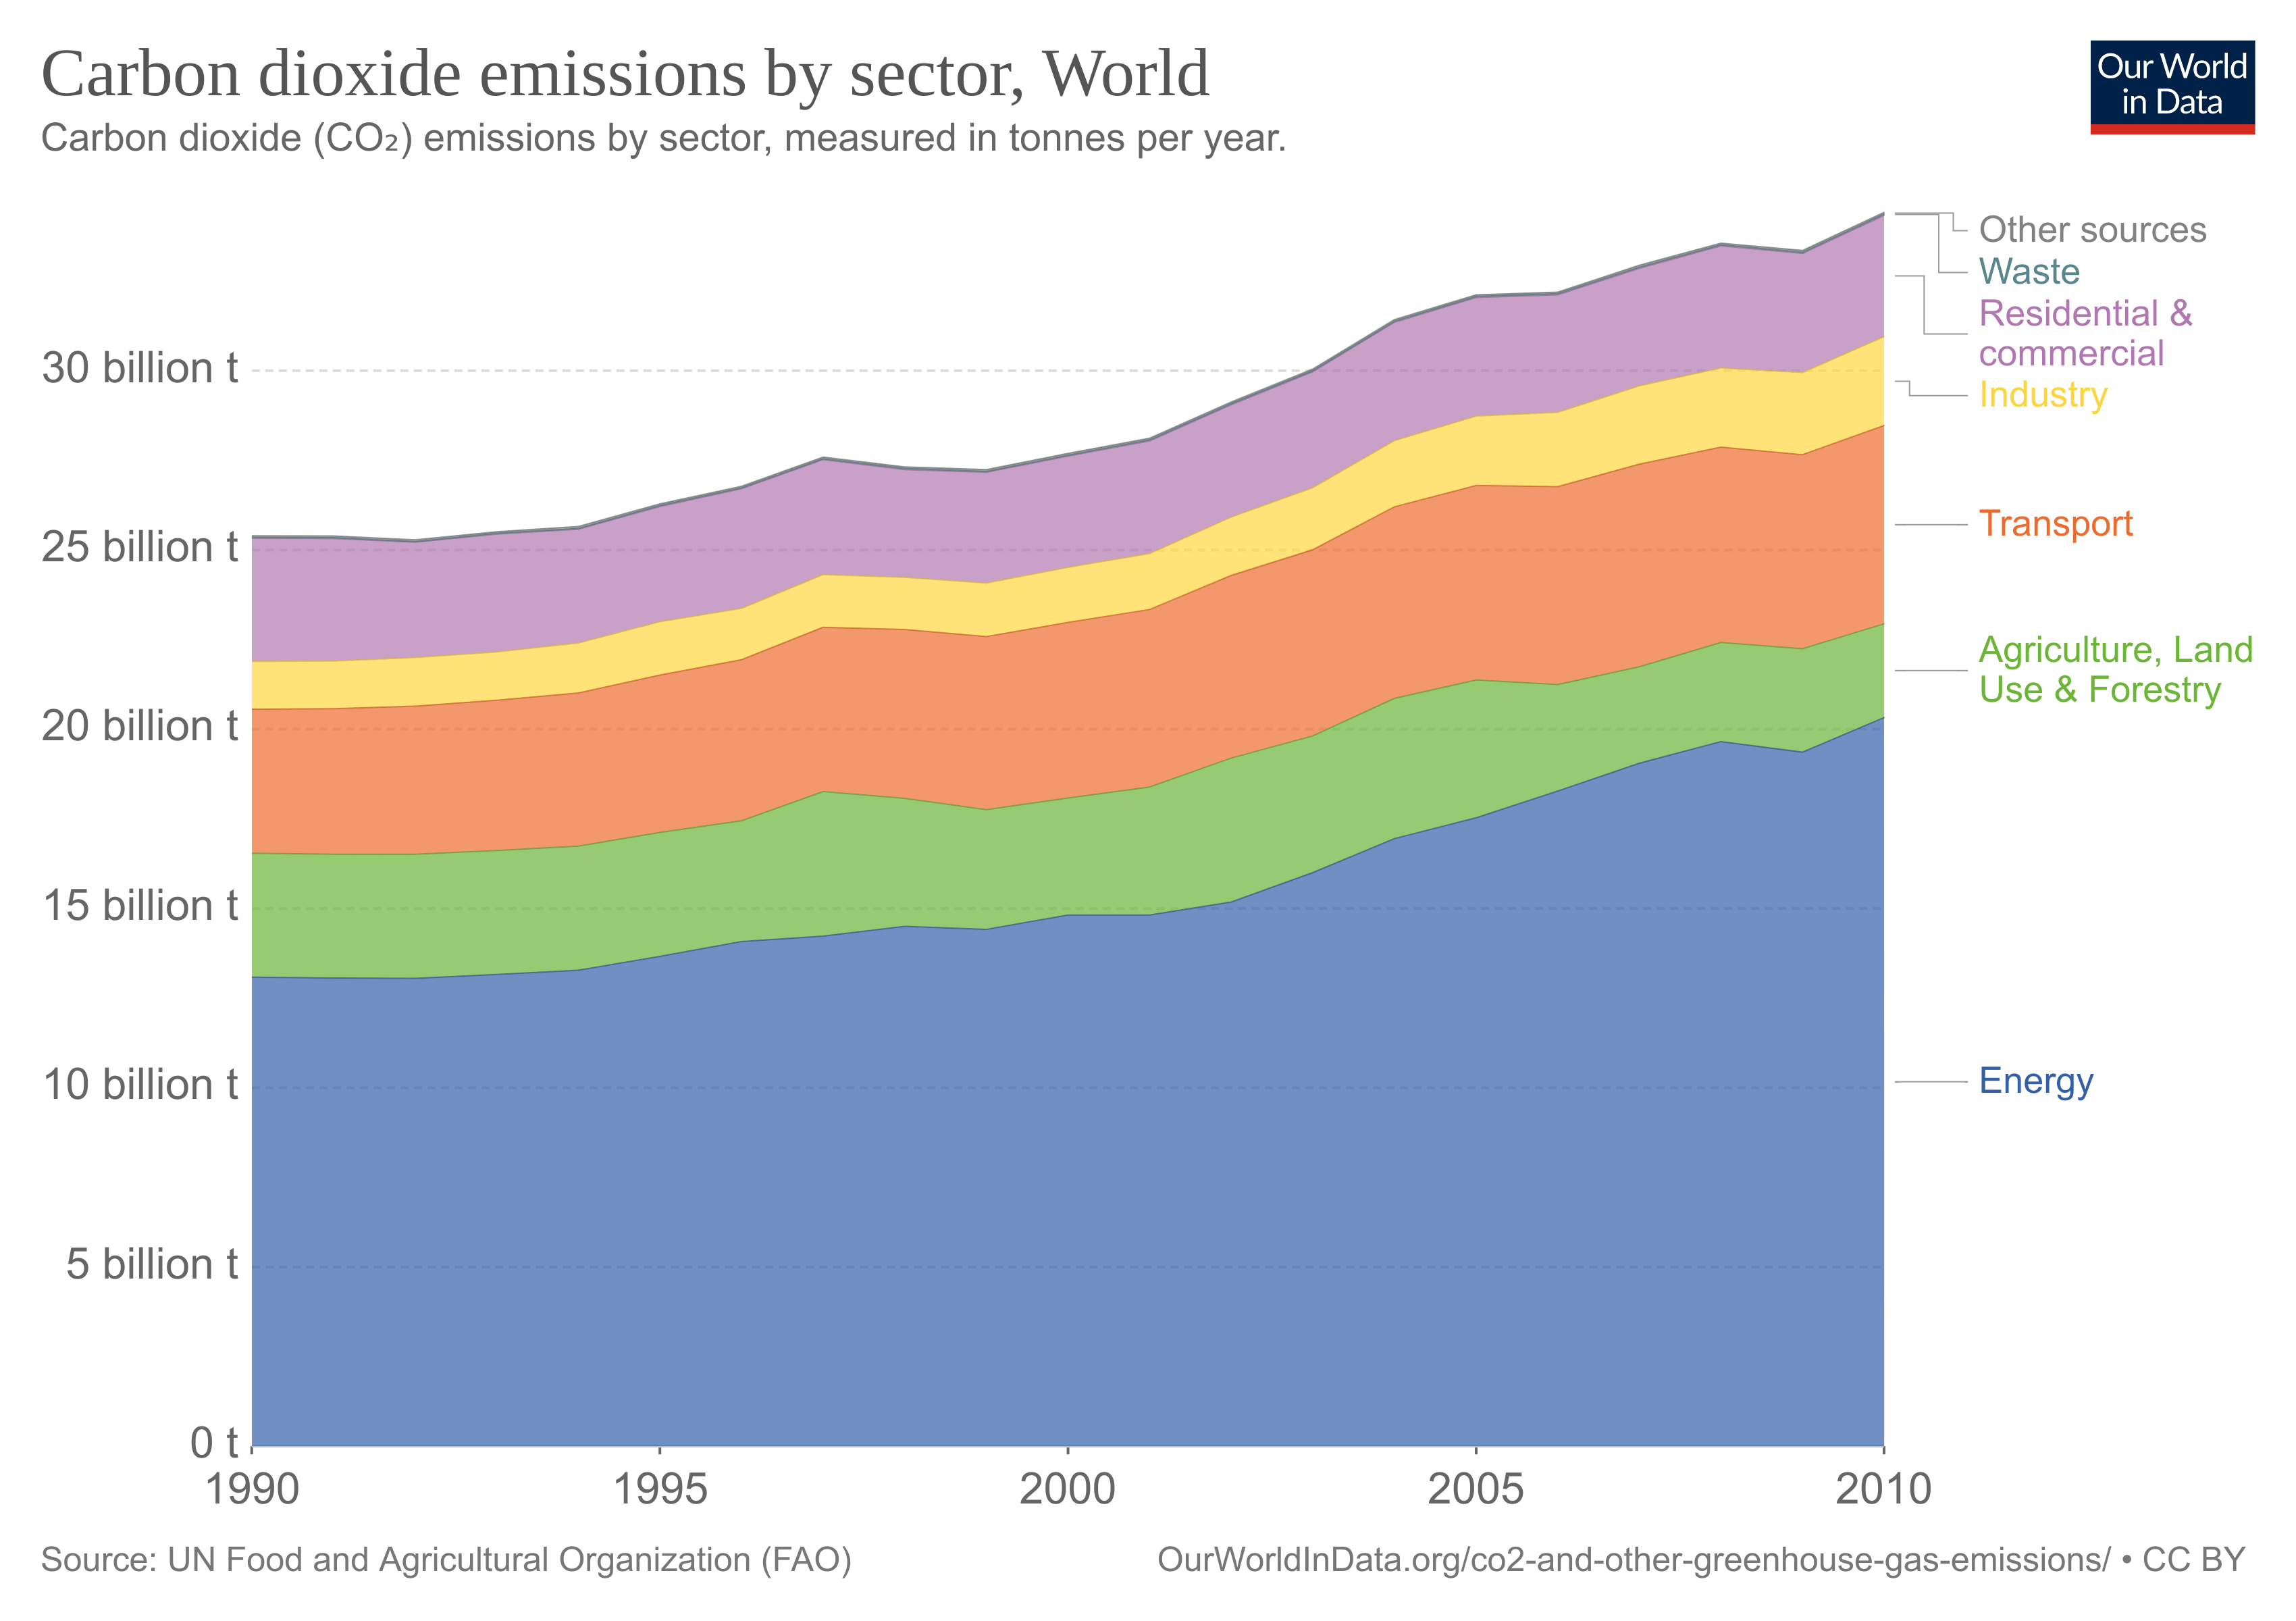
The graph above shows how CO2 emissions have been distributed by sector over the last few decades (touch image to expand).
Explanation of each sector:
- Energy: Use of fossil fuels to produce electricity and heat by the energy, manufacturing, and construction industries.
- Transport: Use of fossil fuels by domestic aviation, road transport, rail transport, domestic shipping, and other transport.
- Residential & commercial: Emissions from homes and businesses.
- Industry: Industrial processes and product use. Production of minerals, chemicals, metals, pulp, paper, food, beverages, halocarbons, refrigeration, and air conditioning; aerosols and solvents; semiconductor/electronics manufacturing; electrical equipment.
- Waste: Solid waste disposal; wastewater management; waste incineration; other waste management.
- Agriculture, Land use & Forestry: Net conversion of forest, cropland, grassland, and biomass burning for agriculture and other uses.
This is how CO2 emissions were distributed in 2017 by continents and countries (touch image to expand):
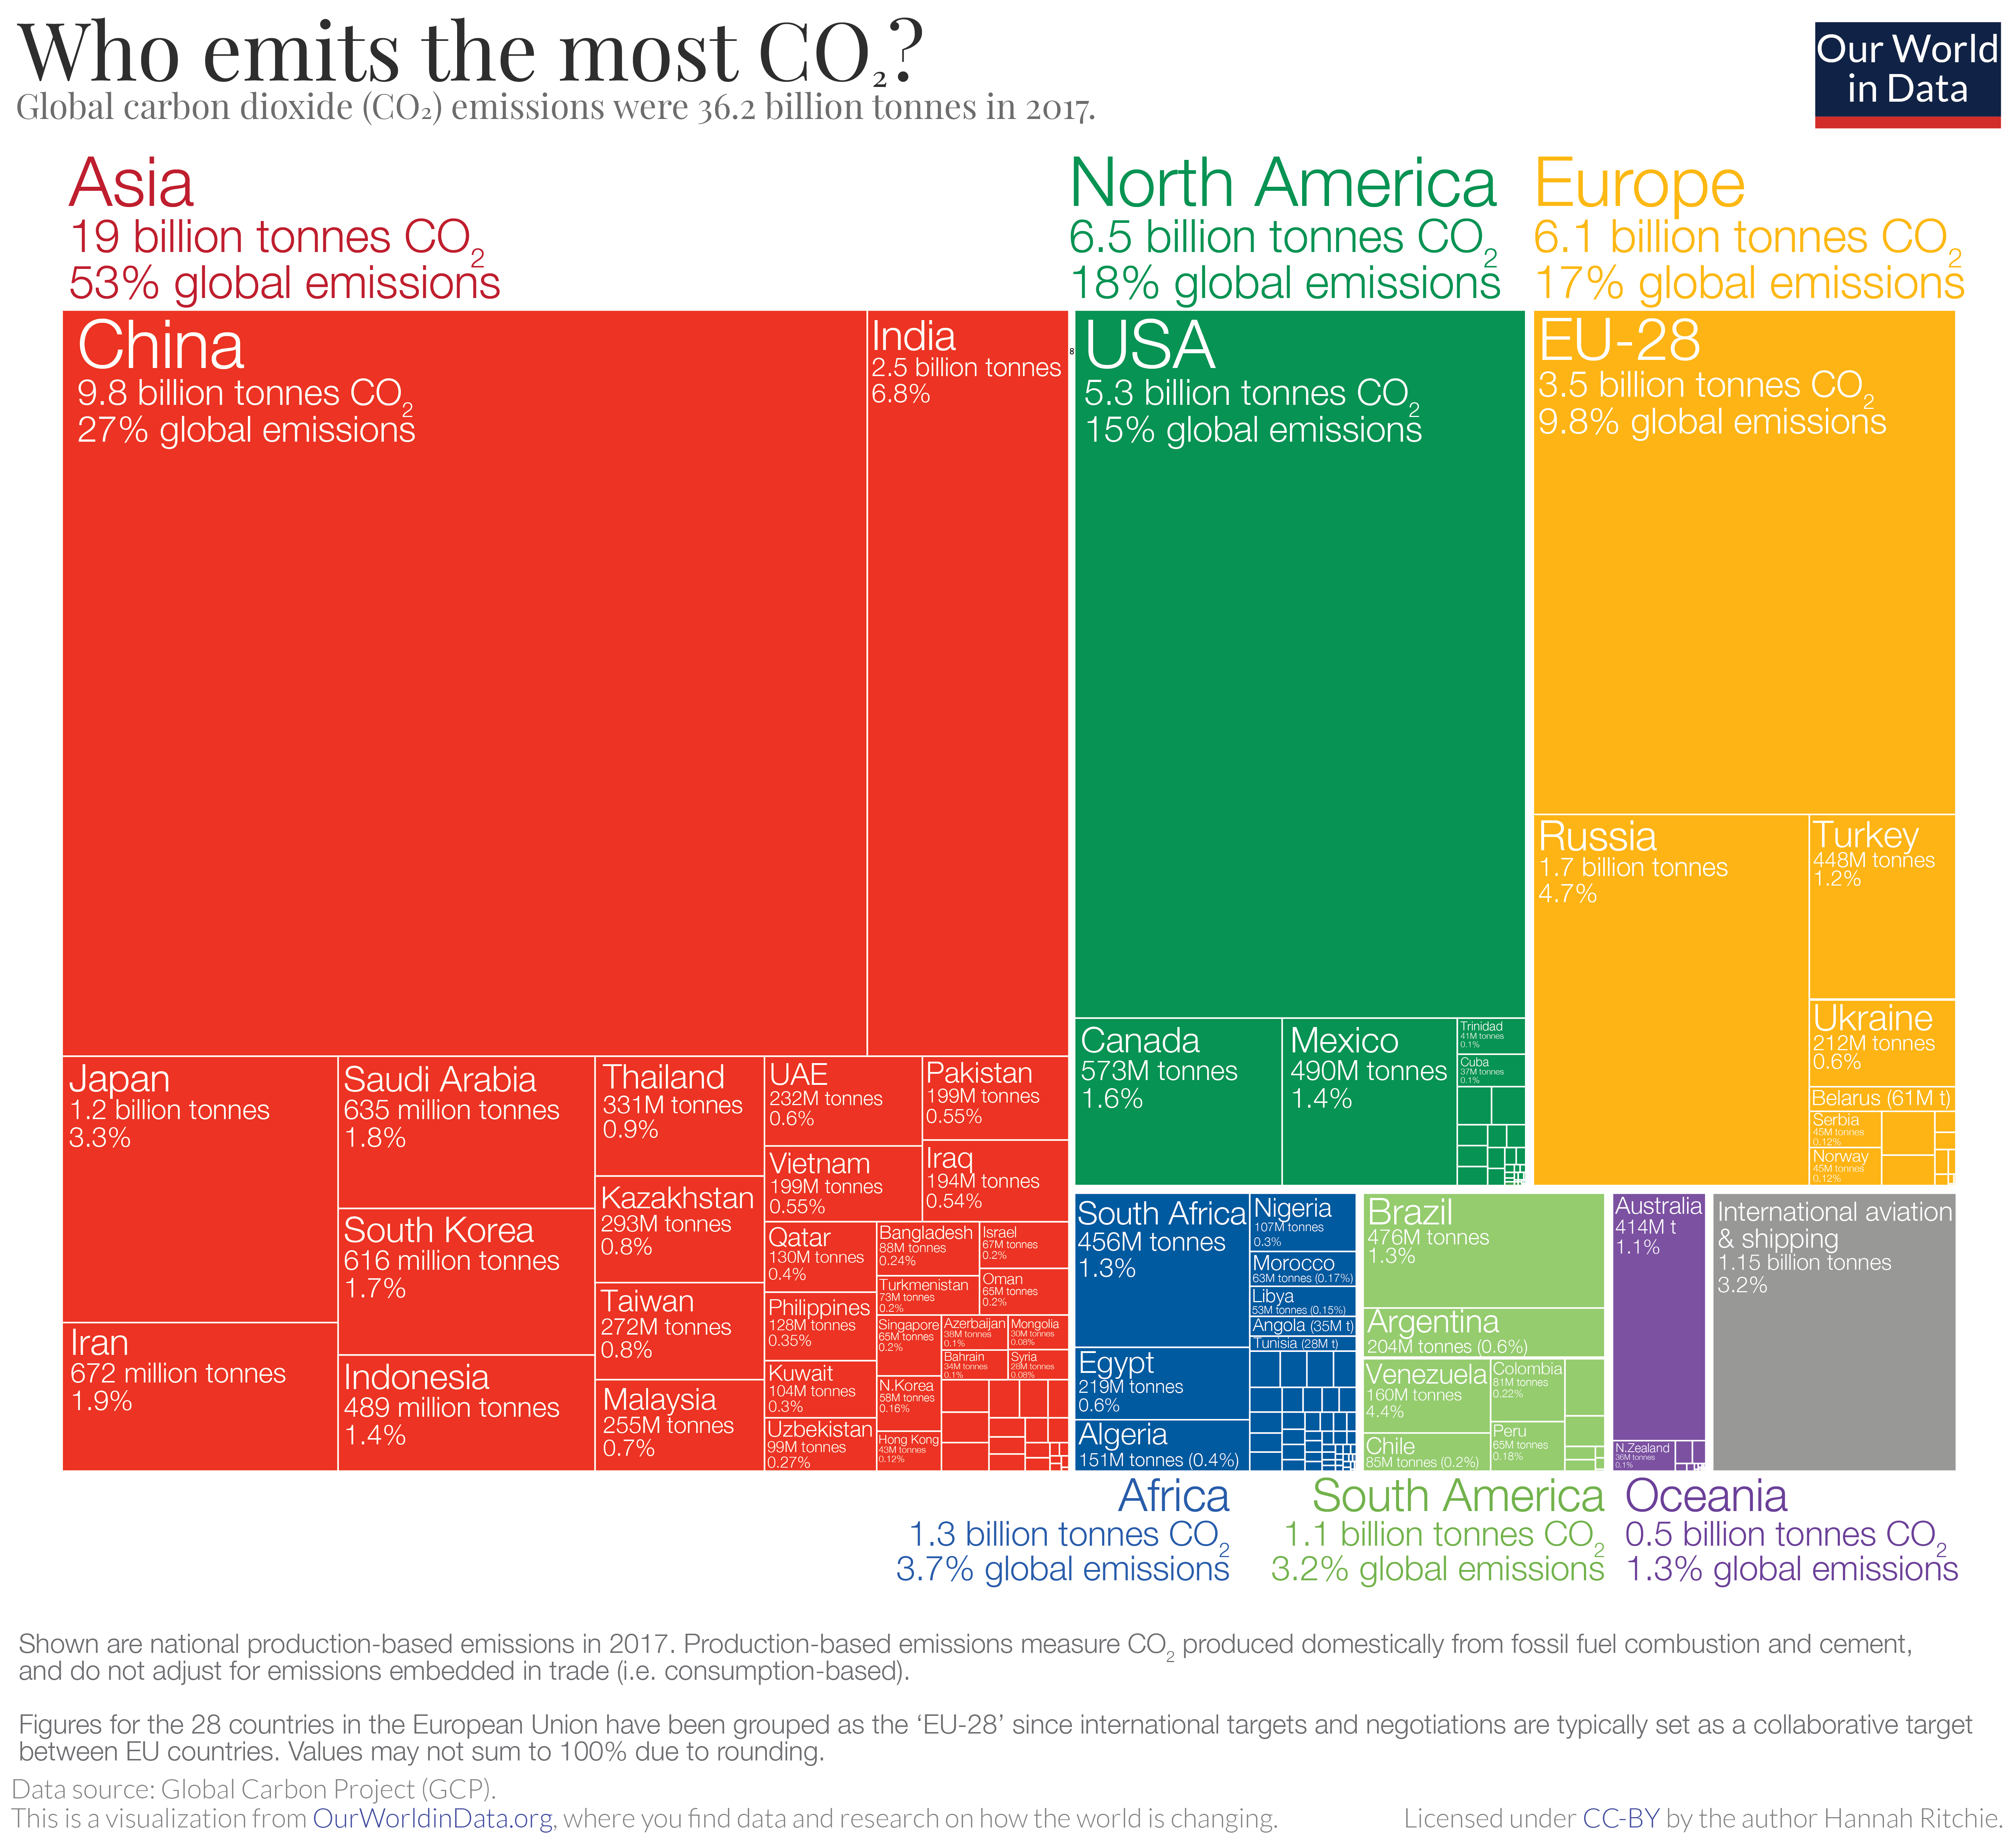
The emissions showed here refer to the country where CO2 is produced, not where the goods and services that generate the emissions are finally consumed.
Both aviation and shipping are not included in this chart. This is because there is no agreement on how emissions that cross country borders should be allocated.
China is the largest emitter in Asia and the world, emitting almost 10 billion tons each year, more than a quarter of global emissions.
North America, led by the United States, is the second-largest regional emitter with 18% of global emissions. It is closely followed by Europe with 17%. European Union countries are grouped (EU-28), as they usually negotiate and set targets as a collective body.
Both Africa and South America are fairly small emitters: they each account for 3-4% of global emissions.
Methane (CH4)
The main emissions of methane of human origin come from landfills, livestock (especially fermentation in farm animals), rice cultivation, biomass burning, as well as the production, transport, and use of fossil fuels.
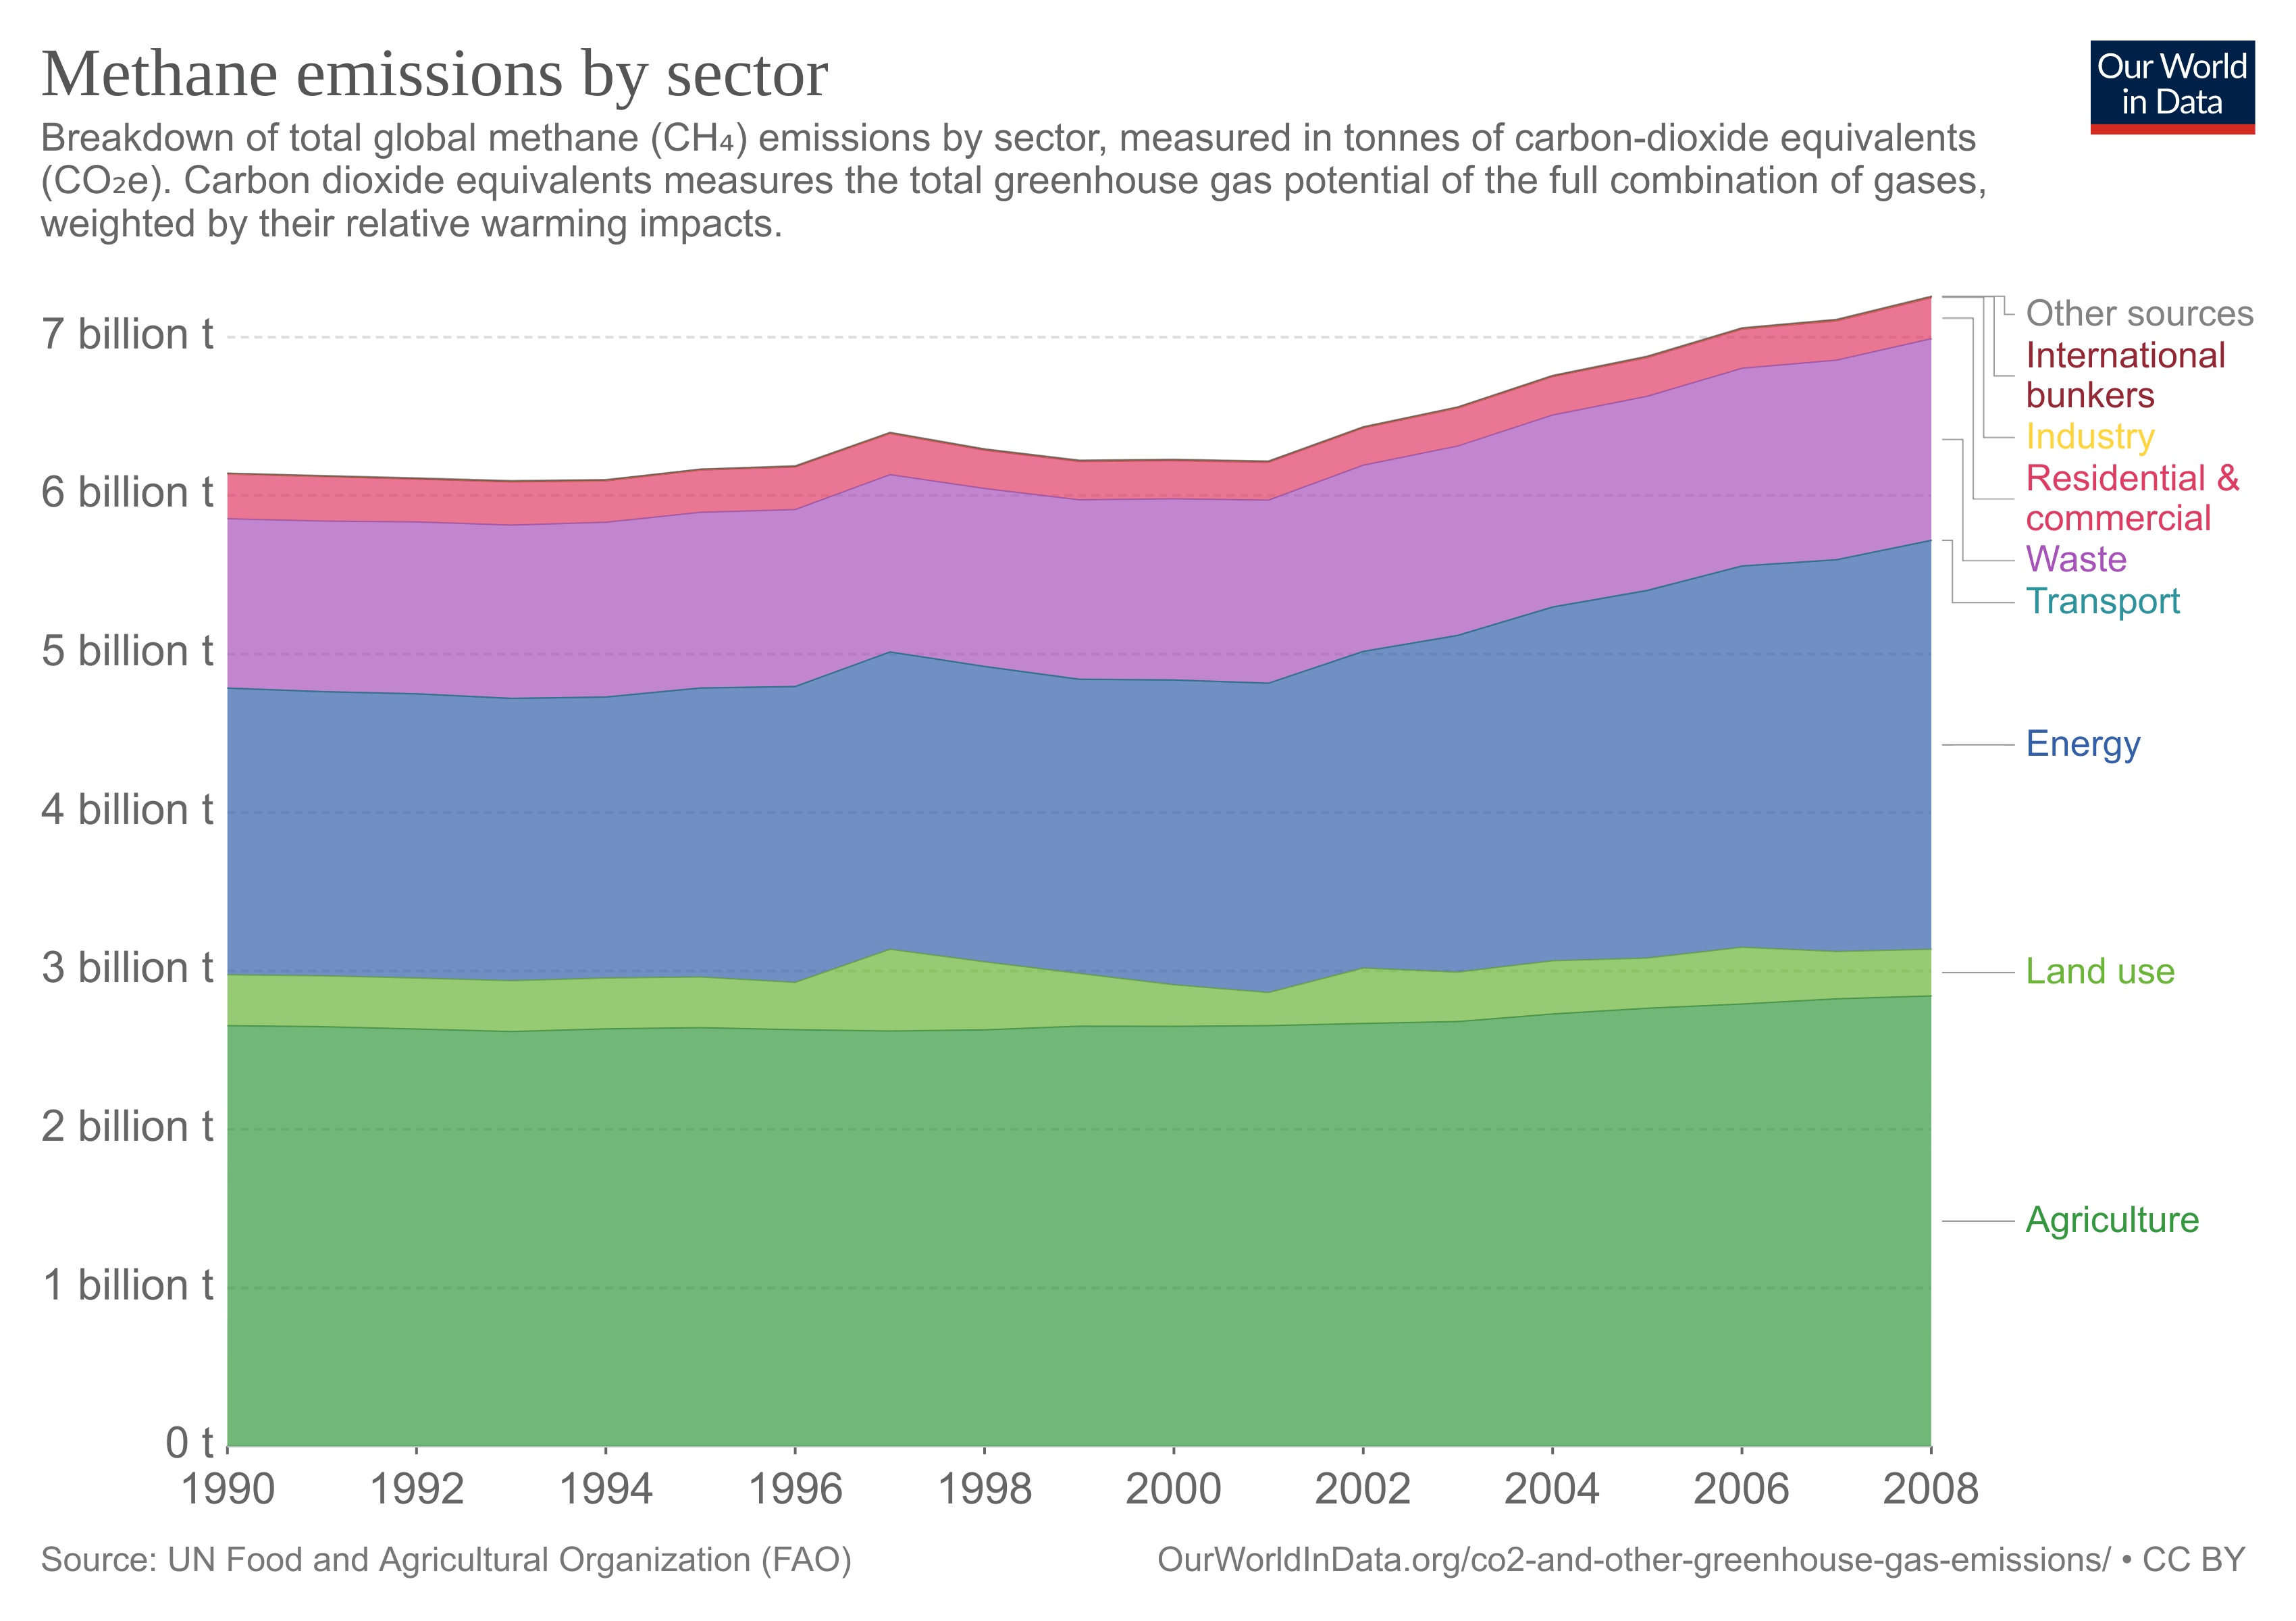
Explanation of sectors that appear for the first time:
- International bunkers: International aviation; international navigation/shipping.
- Agriculture: Emissions from fermentation; manure management; rice cultivation; synthetic fertilizers; manure applied to soil; manure left on pasture; crop residues; residues from the burning of crops, savannah, and organic soil cultivation
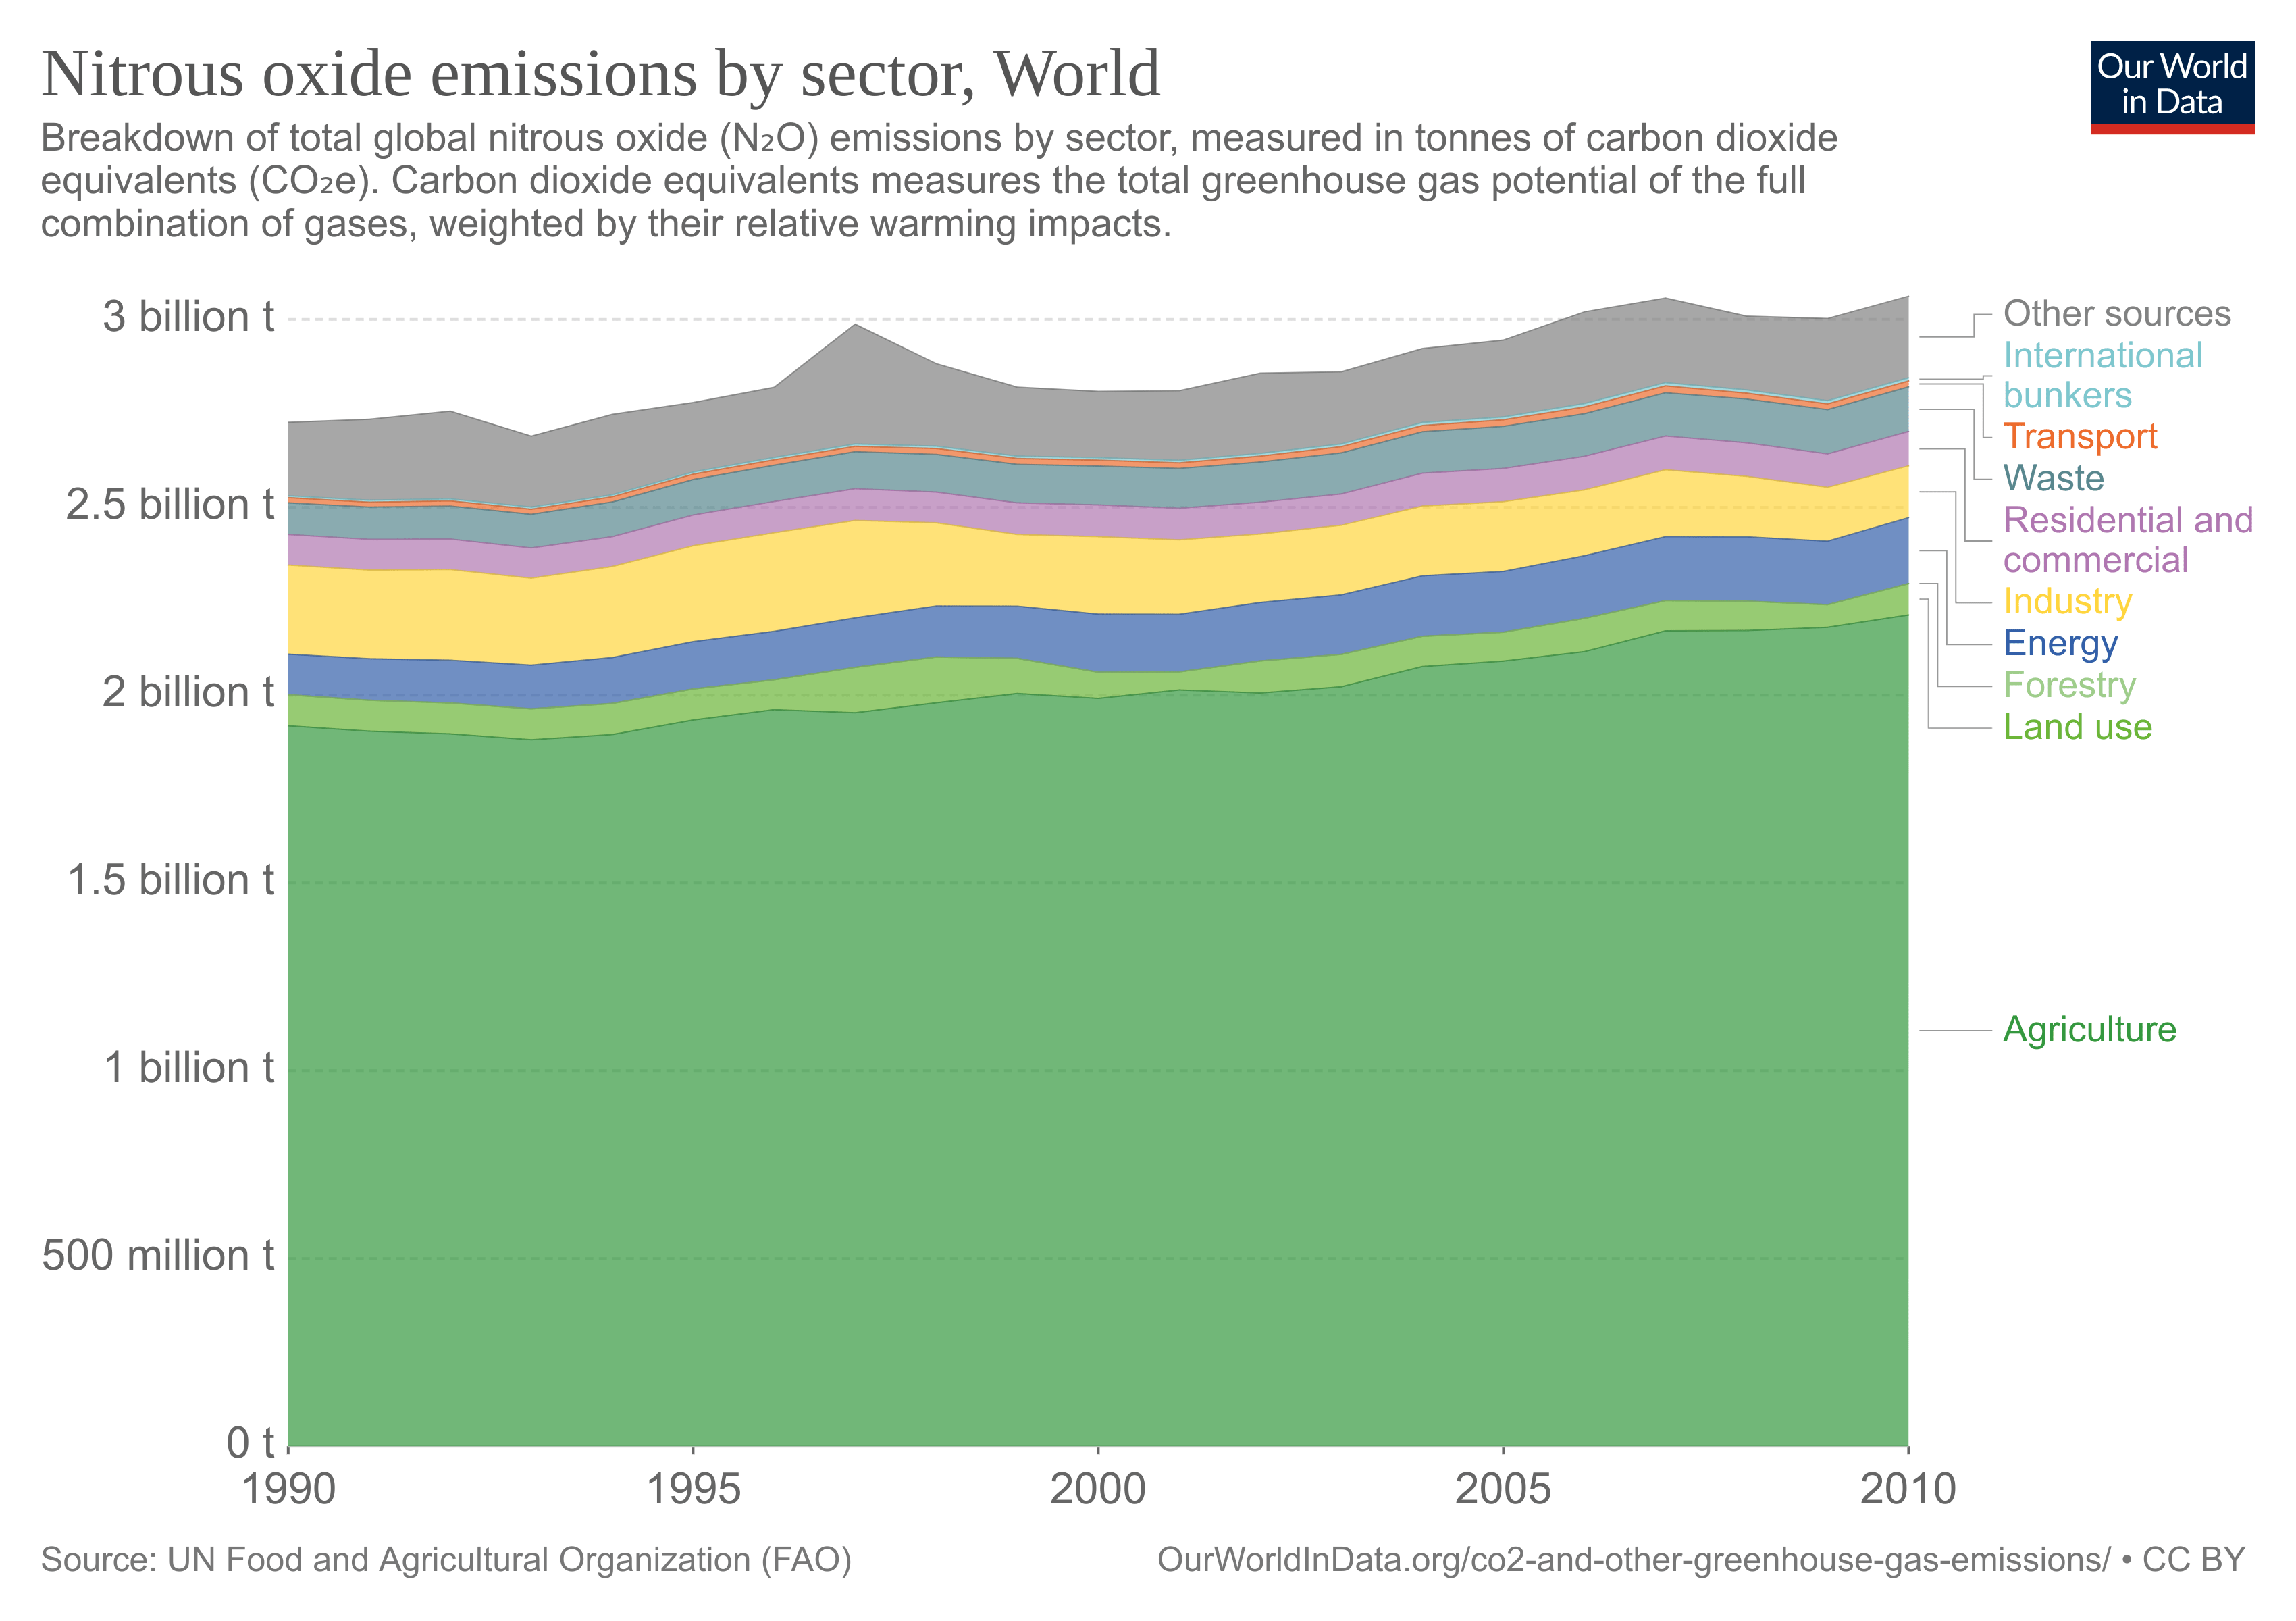
Nitrous oxide (N2O)
Man-made N2O emissions come from agriculture (nitrous oxide fertilizers, soil cultivation), livestock manure, biomass, and fossil fuel combustion, and industrial processes.
N2O emissions by sector (touch image to expand):
Synthetic gases
Synthetic greenhouse gases include halocarbons, such as CFCs (chlorofluorocarbons), HCFCs (hydrochlorofluorocarbons) and HFCs (hydrofluorocarbons). Other synthetic greenhouse gases include perfluorocarbons (PFCs) and sulfur hexafluoride (SF6).
Halocarbons are used, for example, in propellants, refrigeration devices, air conditioning, certain types of heat pumps, and plastic foam.
PFCs are used in the manufacture of aluminum and magnesium and in the enrichment of uranium, they are also used in eye surgery. SF6 is used in power plants as an insulating gas, in gas-insulated switchgear and circuit breakers, and in scientific applications.
Contribution to global warming
The contribution each gas has to global warming is key to understanding how they affect us. One way to measure this is “radiative forcing”, which is the difference between the solar radiation absorbed by the Earth and the radiation it emits back into space. Thus, a positive radiative forcing causes an increase in temperature, while a negative one causes a decrease. The radiative forcing is measured in watts per square meter.
To calculate the responsibility of greenhouse gases in the radiative forcing, it is first necessary to eliminate all the non-human causes that contribute to it, such as differences in the amount of radiation received from the Sun, volcanic eruptions, etc.
After that, the scientists calculate the radiative forcing for each gas, taking into account its current and pre-industrial atmospheric concentration (using the year 1750 as a reference), its radiation transfer capacity, as well as other parameters [6].
These are the main greenhouse gases according to their contribution:
| Gas | Forzamiento radiativo (W/m2) | Contribución % |
|---|---|---|
| Carbon dioxide (CO2) | 1,82 | 64,3 |
| Methane (CH4) | 0,48 | 17 |
| Nitrous oxide (N2O) | 0,17 | 6 |
| CFC-11 | 0,062 | 2,2 |
| CFC-12 | 0,17 | 6 |
| Other gases | 0,128 | 4,5 |
| Total | 2,83 | 100 |
| References | [2] Table 8.2 |
The figures are those used by the IPCC in its Fifth Report, using 2011 data. However, it should be noted that subsequent studies show even higher figures, especially for methane [7].
Greenhouse gases of non-human origin
There are two important greenhouse gases that, although not directly emitted by human action, increase as a result of it: water vapor and ozone.
Water vapour (H2O)
Water vapor is the most abundant greenhouse gas in the atmosphere.
Because man-made greenhouse gases increase the temperature of the atmosphere, more water evaporates from the Earth’s surface (rivers, oceans, reservoirs, soil). Because the air is warmer, the absolute humidity may be higher (in essence, the air can “hold” more water when it is warmer), which increases water vapor in the atmosphere.
However, as water vapor increases in the atmosphere, more of it also condenses into clouds, which can reflect incoming solar radiation (thus allowing less energy to reach the Earth’s surface and warm it). It is because of this and other factors that there are still doubts about how a greater presence of water vapor affects climate change [8].
Tropospheric ozone (O3)
Most of the total ozone in the atmosphere, 90%, is found and forms in the stratosphere and is what protects the Earth from the Sun’s ultraviolet radiation. The rest of the ozone is found and forms in the troposphere.
This tropospheric ozone is formed by chemical reactions between sunlight and other gases, called precursors. The main precursors of ozone are nitrogen oxides, volatile organic compounds (VOCs), methane (CH4), and carbon monoxide (CO).
Tropospheric ozone is not only a greenhouse gas but also a health hazard, accumulating over cities with polluted air and causing thousands of deaths per year from respiratory diseases, in addition to negatively affecting plant growth [9].
Summary
Greenhouse gases are a key part of understanding global warming and climate change. Knowing the fundamentals of their origin and how they affect the planet gives us tools to be critical of an issue that is increasingly politicized.
We encourage you to use this article as a starting point and investigate further if you still have any doubts.
References
- Estimating Changes in Global Temperature since the Preindustrial Period; Ed Hawkins, Pablo Ortega, and Emma Suckling; NCAS-Climate, and Department of Meteorology, University of Reading, Reading, United Kingdom
- Myhre, G., D. Shindell, F.-M. Bréon, W. Collins, J. Fuglestvedt, J. Huang, D. Koch, J.-F. Lamarque, D. Lee, B. Mendoza, T. Nakajima, A. Robock, G. Stephens, T. Takemura and H. Zhang, 2013: Anthropogenic and Natural Radiative Forcing. In: Climate Change 2013: The Physical Science Basis. Contribution of Working Group I to the Fifth Assessment Report of the Intergovernmental Panel on Climate Change [Stocker, T.F., D. Qin, G.-K. Plattner, M. Tignor, S.K. Allen, J. Boschung, A. Nauels, Y. Xia, V. Bex and P.M. Midgley (eds.)]. Cambridge University Press, Cambridge, United Kingdom and New York, NY, USA.
- Atmospheric Lifetime of Fossil Fuel Carbon Dioxide; David Archer, Michael Eby, Victor Brovkin, Andy Ridgwell, Long Cao, Uwe Mikolajewicz, Ken Caldeira, Katsumi Matsumoto, Guy Munhoven, Alvaro Montenegro, and Kathy Tokos; Annual Review of Earth and Planetary Sciences Vol. 37:117-134
- Hartmann, D.L., A.M.G. Klein Tank, M. Rusticucci, L.V. Alexander, S. Brönnimann, Y. Charabi, F.J. Dentener, E.J. Dlugokencky, D.R. Easterling, A. Kaplan, B.J. Soden, P.W. Thorne, M. Wild and P.M. Zhai, 2013: Observations: Atmosphere and Surface. In: Climate Change 2013: The Physical Science Basis. Contribution of Working Group I to the Fifth Assessment Report of the Intergovernmental Panel on Climate Change [Stocker, T.F., D. Qin, G.-K. Plattner, M. Tignor, S.K. Allen, J. Boschung, A. Nauels, Y. Xia, V. Bex and P.M. Midgley (eds.)]. Cambridge University Press, Cambridge, United Kingdom and New York, NY, USA.
- Benhelal, E., Zahedi, G., Shamsaei, E., & Bahadori, A. (2013). Global strategies and potentials to curb CO2 emissions in cement industry. Journal of cleaner production, 51, 142-161.
- Radiative Forcing of Climate Change; V. Ramaswamy, O. Boucher, J. Haigh, D. Hauglustaine, J. Haywood, G. Myhre, T. Nakajima, G.Y. Shi, S. Solomon
- Etminan, M., Myhre, G., Highwood, E. J., & Shine, K. P. (2016). Radiative forcing of carbon dioxide, methane, and nitrous oxide: A significant revision of the methane radiative forcing. Geophysical Research Letters, 43(24), 12-614.
- Sherwood, S. C., Roca, R., Weckwerth, T. M., & Andronova, N. G. (2010). Tropospheric water vapor, convection, and climate. Reviews of Geophysics, 48(2).
- Ainsworth, E. A., Yendrek, C. R., Sitch, S., Collins, W. J., & Emberson, L. D. (2012). The effects of tropospheric ozone on net primary productivity and implications for climate change. Annual review of plant biology, 63, 637-661.